  • Live support 8am – 12 midnight EST
  • 762-235-7265
  • Free U.S. shipping
  • 30-day risk-free trial
  • Lifetime warranty
$0.00 0

Cart

Performance Analysis Kit added.

No products in the cart.

Journal

The Thorton Blog
Owner Guides

How We Test Thorton Performance Chips, and How to Measure Your Own Gains

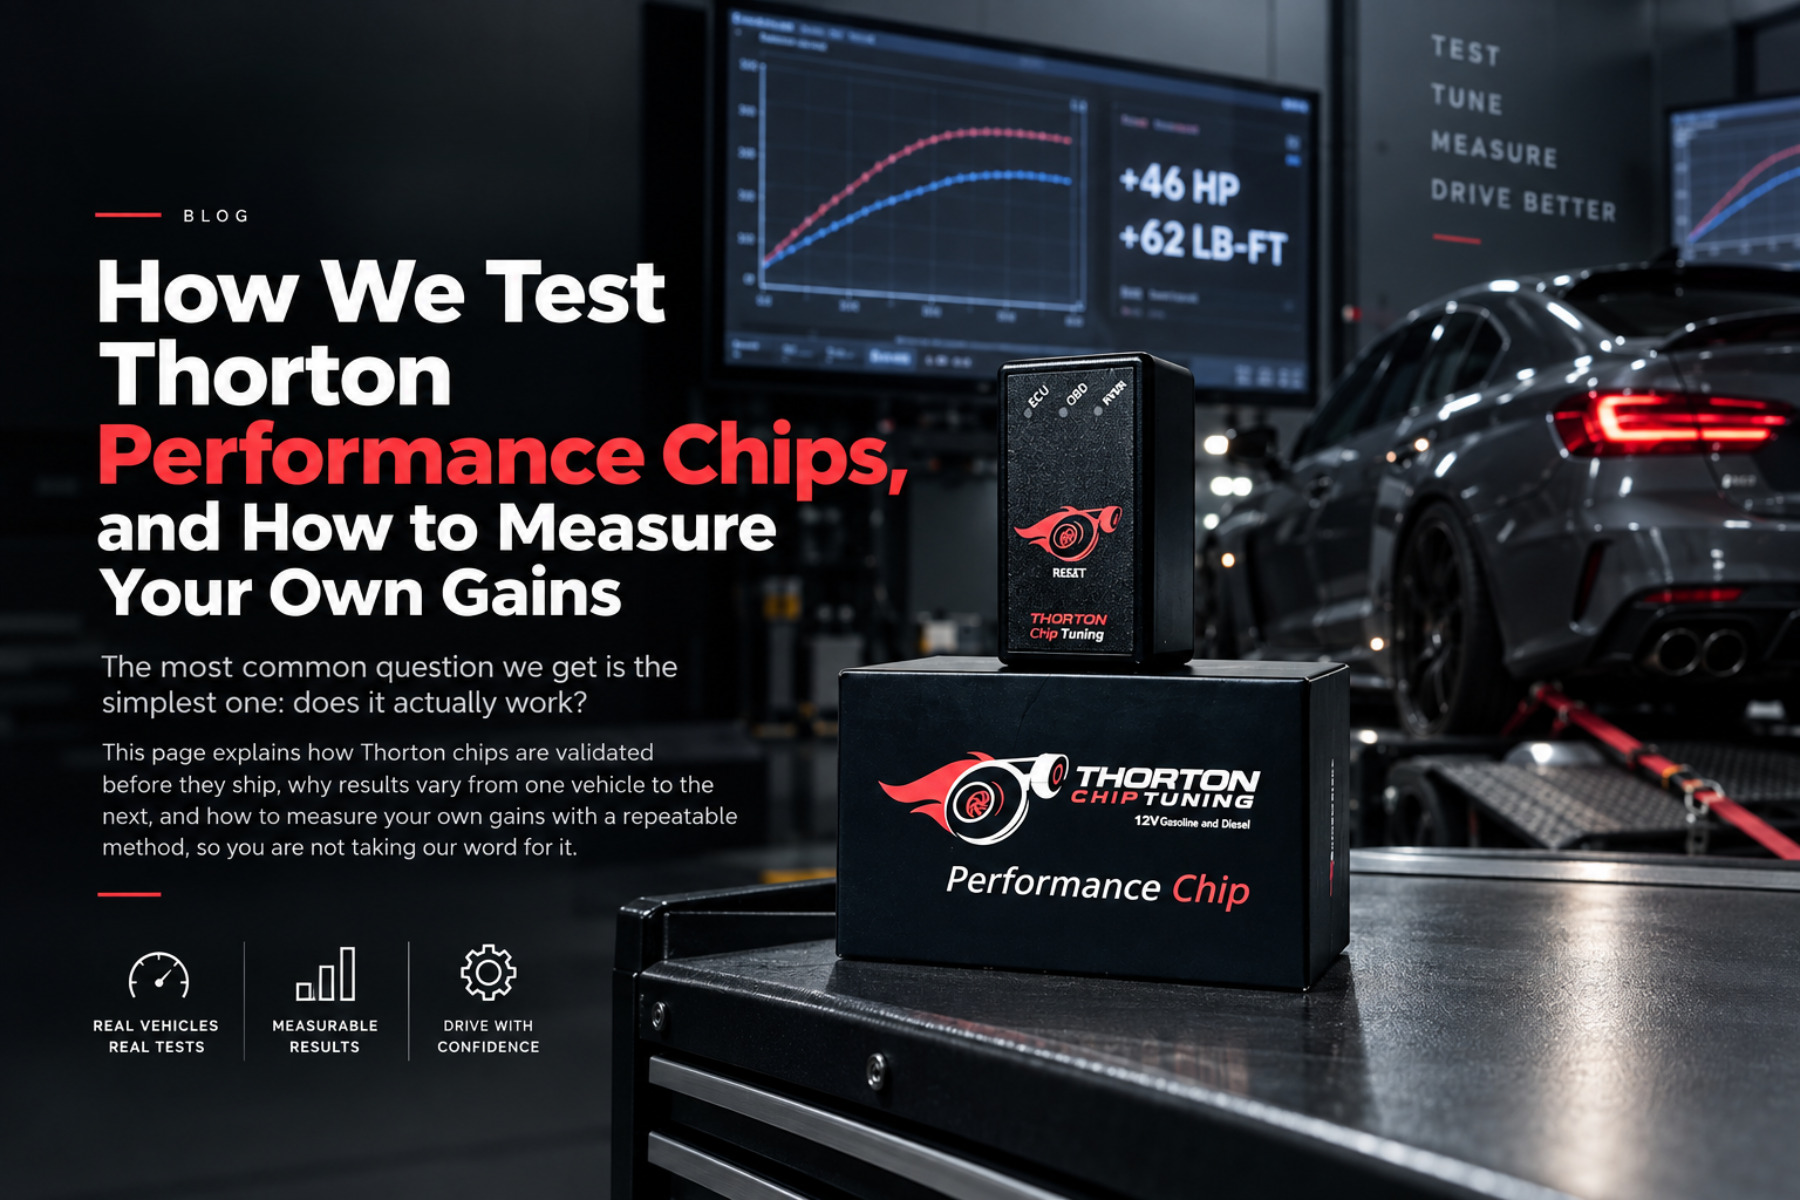
Thorton performance chip and its box on a workbench in a dyno bay, a dyno graph behind it reading +46 HP and +62 lb-ft, headlined 'How We Test Thorton Performance Chips, and How to Measure Your Own Gains'.

The most common question we get is the simplest one: does it actually work? This page explains how Thorton chips are validated before they ship, why results vary from one vehicle to the next, and how to measure your own gains with a repeatable method, so you are not taking our word for it.

What a Thorton chip does, in one paragraph

The chip plugs into the OBD2 port and works on the live signals your engine control unit reads. It keeps the engine in the more responsive part of its factory map, sharpening throttle mapping and, on forced-induction engines, bringing boost in sooner. It never rewrites the ECU and it cannot exceed the limits the factory calibration enforces, which is why it can be removed without a trace. The three stages use progressively more of the available range.

How the chips are tested before they ship

Our tunes are validated across a varied test fleet, including a 2021 Subaru WRX, 2025 Ford Explorer, and a 2018 Maserati Levante. Gains are measured using a chassis dyno on a fixed route to provide consistent, repeatable results. Each vehicle is tested before and after tuning, with stages required to demonstrate a measurable increase in performance.

Example results: All three test vehicles showed measurable increases following tuning, including the Subaru WRX, Ford Explorer, and Maserati Levante.
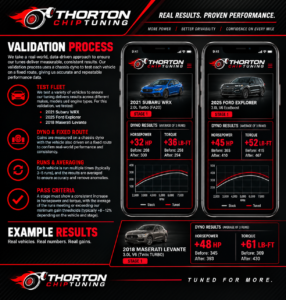
How We Test Thorton Performance Chips, and How to Measure Your Own Gains 1

Why results vary between vehicles

  • Headroom. Turbocharged and supercharged engines have the most, because boost and timing are where the factory leaves the largest margin. Big naturally aspirated V8s respond mostly in throttle response and mid-range torque.
  • Fuel. Premium fuel lets the ECU run more timing before knock control intervenes, so gains are larger on 91 or 93 octane.
  • Condition. A clogged air filter, worn plugs or a slow oxygen sensor limit what any tune can achieve.
  • Adaptation. The chip learns over the first drives. Measuring on day one understates the result.
  • The driver. Fuel economy only improves if you drive the way you did before. Use the extra power and consumption goes up.

How to measure your own gains

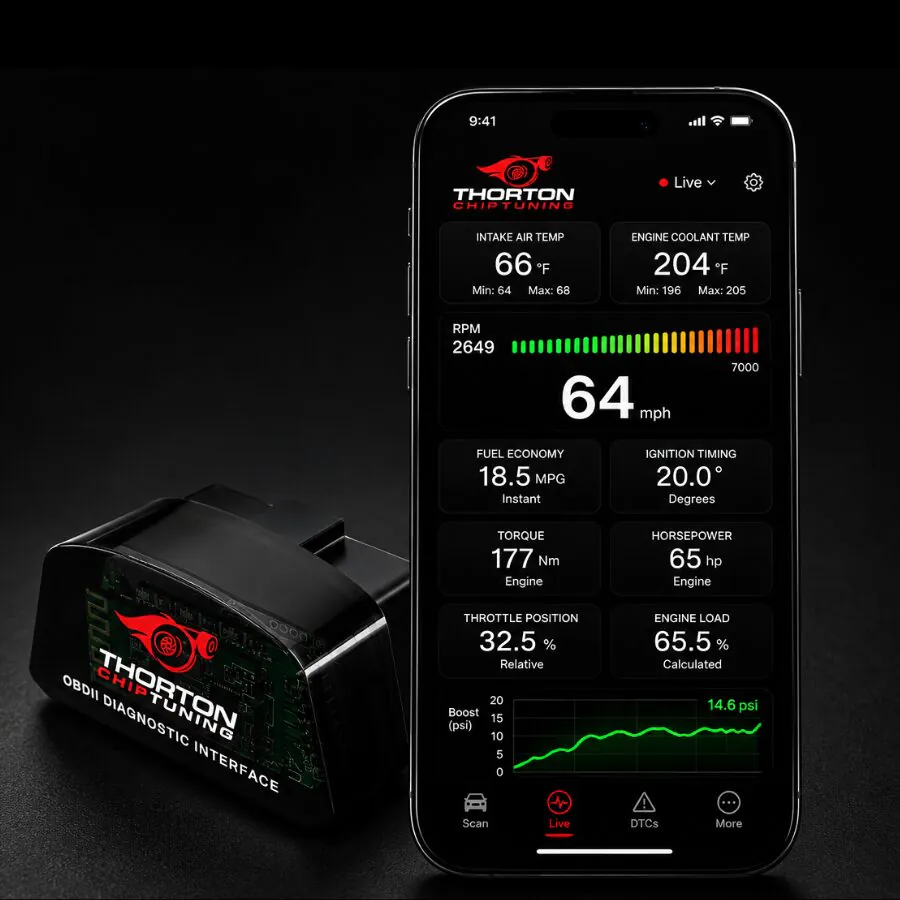
You need an OBD2 reader that logs live data. The Performance Analysis Kit is the one we sell, but the method works with any logger that records calculated horsepower, torque and fuel economy.

  1. Baseline first. Before installing the chip, pick a route you can repeat: a highway on-ramp for acceleration and a 20-mile loop for economy. Fill the tank with the fuel you normally use.
  2. Log three acceleration runs from a rolling 20 mph to 60 mph on the same stretch, same gear selection, and note the peak horsepower and torque the reader calculates. Average the three.
  3. Log the economy loop at your normal pace and record the trip MPG.
  4. Install the chip and drive normally for a full tank so it can adapt.
  5. Repeat steps 2 and 3 on the same route, same fuel, similar weather. Compare the averages.

Expect the acceleration figures to change first and the economy figure to settle over the second tank. If your numbers do not move, check that all three LEDs on the chip light with the engine running and that the chip’s label matches your engine; then contact support.

What customers report

Thorton has shipped more than 200,000 orders since 2023 and holds a 4.9-star average across more than 2,300 verified reviews. The most consistent reports are sharper throttle response, stronger mid-range pull when towing, and a modest economy gain on highway commutes. Read them on the reviews page; each review is tied to the make the customer bought.

If it does not work for you

Every chip carries a 30-day risk-free trial. Measure it, and if the result is not there, return it for a full refund. Details on the returns page.

Ready to experience
more power?

Find your vehicle and see your gains in seconds.

Find my vehicle ›
Free U.S. shipping 30-day trial
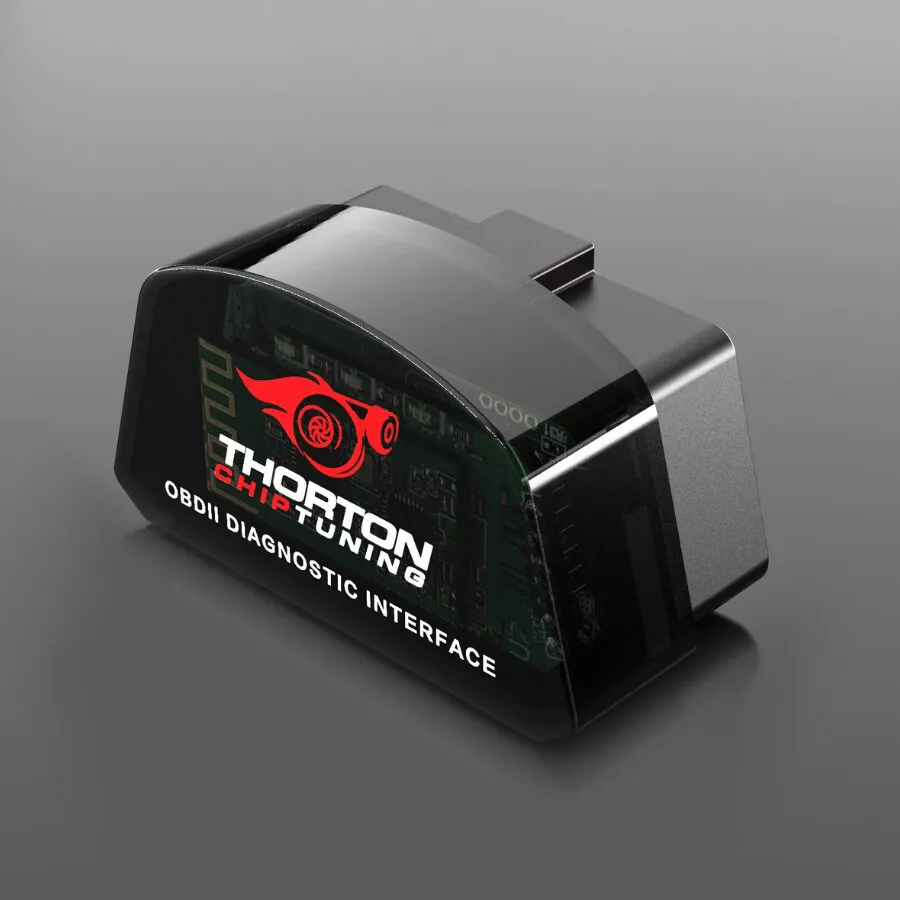
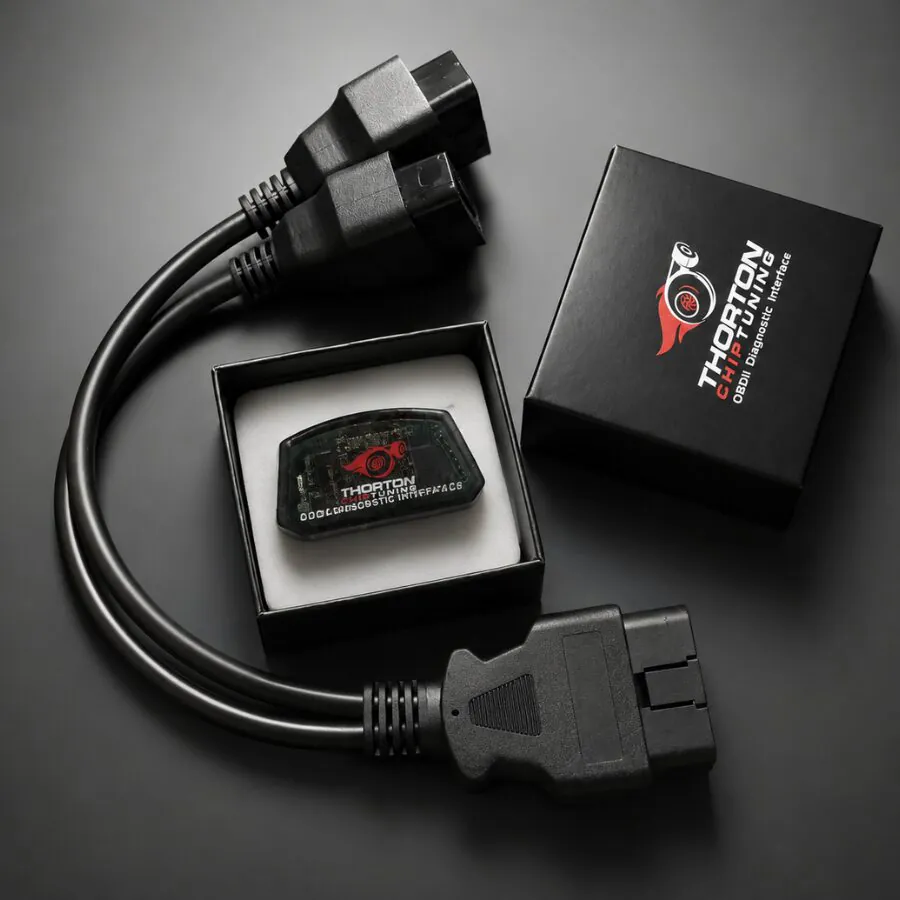
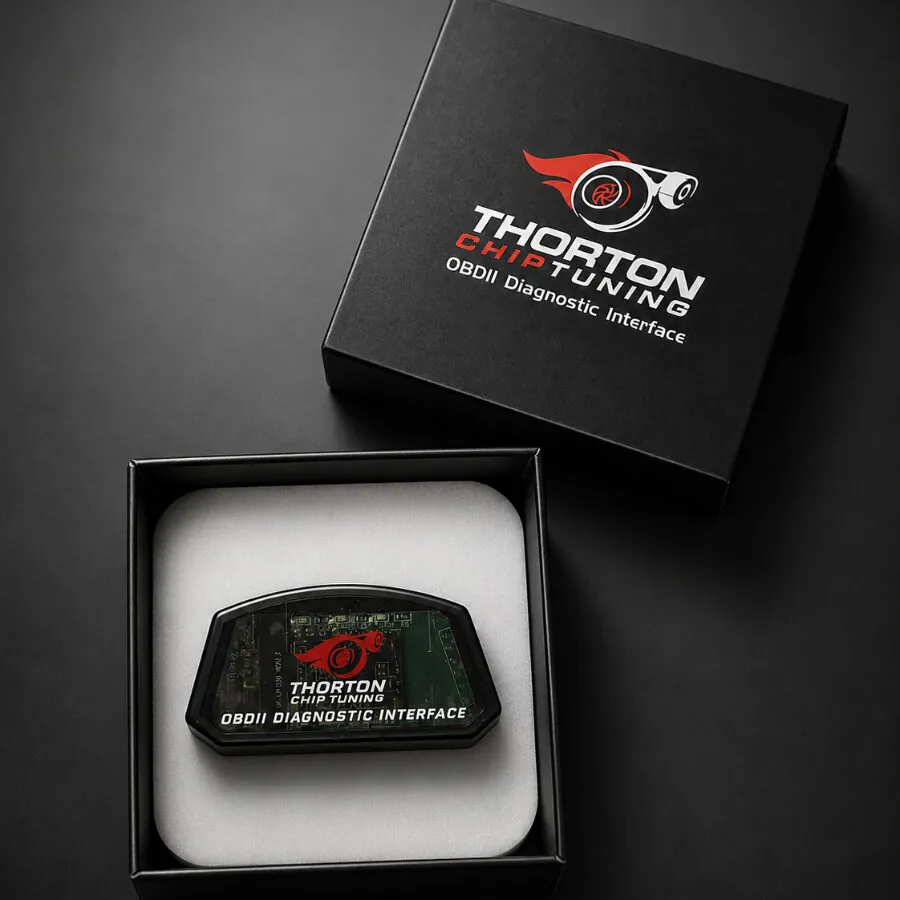
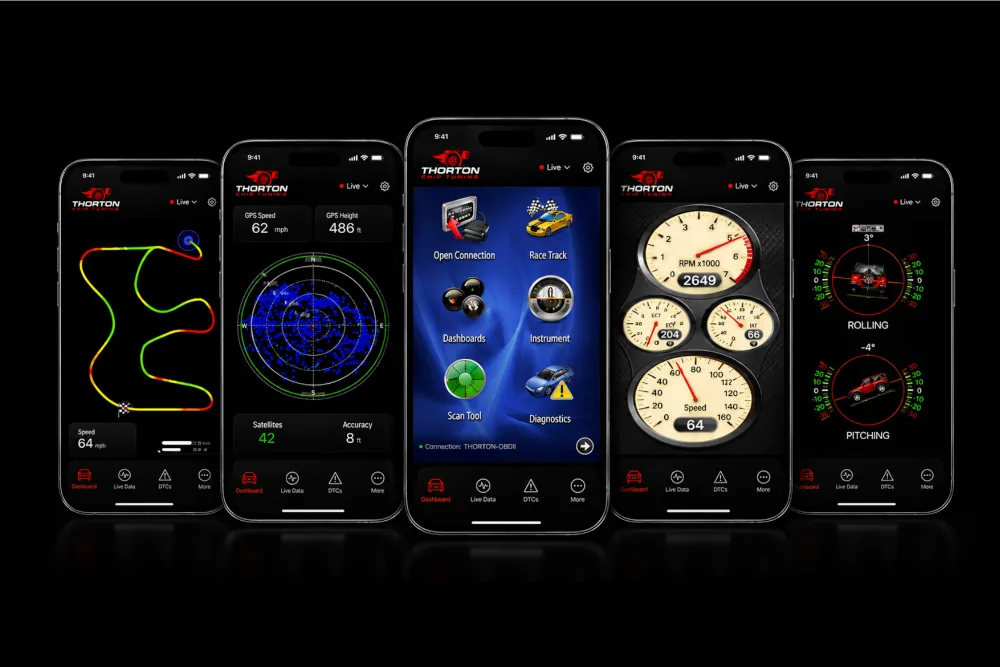
Thorton Performance Analysis Kit – Bluetooth/WiFi OBD2 reader, view 5
Thorton Performance Analysis Kit – Bluetooth/WiFi OBD2 reader, view 1
Thorton Performance Analysis Kit – Bluetooth/WiFi OBD2 reader, view 2
Thorton Performance Analysis Kit – Bluetooth/WiFi OBD2 reader, view 3
Thorton Performance Analysis Kit – Bluetooth/WiFi OBD2 reader, view 4
Thorton Performance Analysis Kit – Bluetooth and WiFi OBD2 reader for iOS and Android
Optional add-on

Performance Analysis Kit

The companion to your Thorton chip. See real performance gains, monitor engine health and diagnose issues from your phone.

  • Real-time performance data
  • Read & clear trouble codes
  • Monitor & log engine health
  • Works with iOS & Android
Connection type
$59.95 $49.95 Save $10 with any chip order

$59.95 on its own. The $10 comes off automatically when a Thorton Performance Chip is in the same order.
No thanks, continue without the kit